User Tutorial { how-to run PrimerSeq }
Installation
- Download the latest version from sourceforge
- Follow the installation instructions:
Running PrimerSeq
- Load files
- Enter target coordinates
- Edit options (optional)
- Select output file
- Run PrimerSeq
- Plot Results (optional)
1. Load Files
First, you need to download the files used in this tutorial. Two samples, testes and heart, from Human Body Map 2.0 are used. Differential alternative splicing between testes and heart would indicate tissue specific splicing patterns.
- Minified User tutorial data, data only contains information for this user tutorial example.
- Full User Tutorial data, contains the full data but will take much longer to download
You will also need:
- a GTF file for UCSC knownGene annotation
- the genome sequence for hg19
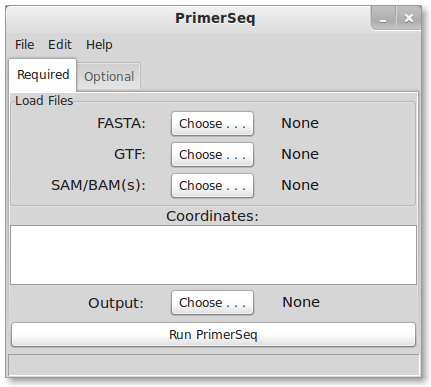
FASTA
Check the downloads page for links to genome sequences in FASTA format. If you have access to linux, I recommend downloading sequences from UCSC .2bit format. Generally the FASTA files will be compressed so you will need to decompress the sequences either via command line or using a graphical interface like 7-Zip (7-Zip is Windows only).
GTF
For this tutorial we are using UCSC Known Genes annotation in GTF format. UCSC Known Genes is generally the recommended gene annotation for running PrimerSeq. Ultimately, the choice of where you obtain the GTF is up to you. You could download GTFs known to work from the PrimerSeq sourceforge website, download GTFs from UCSC or Ensembl, or use GTF output from transcript assemblers like Cufflinks. You can also mix several GTF files into a single input GTF file for PrimerSeq! For more detailed explanations please click here.
SAM/BAM file
You can specify none, one or multiple SAM or BAM files as input. In this tutorial, two BAM files are used. Make sure to hold down the ctrl key to select multiple files. SAM/BAM files are the typical output format from read aligners like Tophat. The SAM/BAM file allows PrimerSeq to estimate the relative abundance of different isoforms and find novel PCR products supported by RNA-Seq. If you know your BAM file is sorted (like the output from Tophat) then please name the BAM file with a .sorted.bam extension so PrimerSeq does not try to re-sort the file.
2. Enter Targets
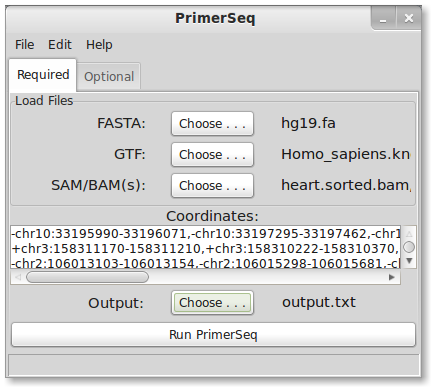
For this tutorial, differential skipped exon events between heart and testes were found using Multivariate Analysis of Transcript Splicing (MATS). A small sample list of events can be found here. The contents can be directly copied and pasted into the coordinates text box. A few lines are shown below.
-chr10:33195990-33196071,-chr10:33197295-33197462,-chr10:33189245-33190563
+chr3:158311170-158311210,+chr3:158310222-158310370,+chr3:158314650-158314734
-chr11:111956701-111957034,-chr11:111957363-111957522,-chr11:111955538-111956186
Each line represents one skipped exon event. Each coordinate is separated by a comma. The first coordinate is the skipped exon. The second is the upstream flanking exon and the third is the downstream flanking exon. NOTE: This syntax is different from the getting started tutorial were only one coordinate was specified in each case. Specifying the flanking exons allows primers to be placed exactly on the exons you designate. By not specifying flanking exons in the getting started tutorial, PrimerSeq automatically determined the flanking exons by choosing based on high exon inclusion level.
Coordinate Format
Enter target coordinates as (strand)chr:start-end as seen above. The first nucleotide on a chromosome is at position 0. The end position is not inclusive. If you wish PrimerSeq to determine the flanking exons then only enter the alternatively spliced exon’s coordinates. You may also specify the flanking exons for primer design by adding upstream exon coordinates followed by the downstream exon coordinates (separated by commas).
3. Edit Options
Option Descriptions
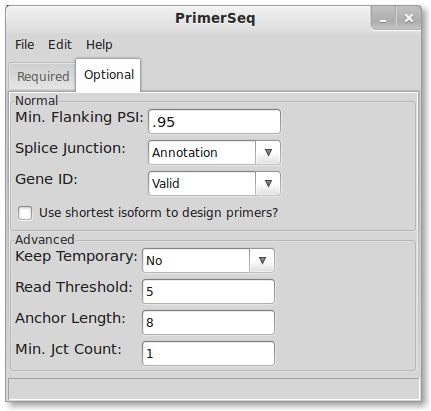
- Minimum Flanking PSI: minimum inclusion level where a primer is allowed to be placed on that exon
- Splice Junction: source for defining exon junctions
- Gene ID: flag for whether the GTF has a valid Gene ID
- Shortest isoform: use the shortest isoform for primer design. This means specifying product size restrictions (Edit->Primer3) will effectively set a minimum product size for all isoforms.
- Keep Temporary: flag for keeping temporary files created when running PrimerSeq
- Read Threshold: minimum read count necessary to define a novel junction from RNA-Seq
- Anchor Length: minimum number of bases on both sides of a junction for a read to be considered valid
- Min. Jct Count: assign at least this number of reads to a junction known in the GTF annotation
Primer3 Options
You can also specify the parameters to Primer3 by clicking Edit and then Primer3. “primer3.txt” (by default) should now open in your default text editor. You should modify the configuration file in concordance with the Primer3 manual io version 3. You can view the Primer3 manual in the Primer3 Doc. option under the View menu. The first few lines of primer3.txt are shown below.
###########################################
# When running primer3, PrimerSeq will use the
# below primer3 options. If an option is left
# empty, then PrimerSeq relies on primer3's
# default values. Note, the GUI changes options
# by saving the options to this config file.
# Do not add additional parameters!!!!
###########################################
PRIMER_PRODUCT_SIZE_RANGE=115-400
PRIMER_MIN_GC=40
PRIMER_MAX_GC=69
PRIMER_MIN_SIZE=15
PRIMER_MAX_SIZE=27
PRIMER_MIN_TM=50
PRIMER_MAX_TM=70
PRIMER_PAIR_MAX_DIFF_TM=2.0
PRIMER_MAX_NS_ACCEPTED=1
PRIMER_MAX_SELF_ANY=4
PRIMER_INTERNAL_MAX_SELF_ANY=4
PRIMER_INTERNAL_MAX_SELF_END=4
PRIMER_INTERNAL_OPT_GC_PERCENT=55
PRIMER_INTERNAL_OPT_SIZE=20
You can also change the primer3 configuration file to something other than “primer3.txt”. This allows multiple custom configurations for primer3 to be switched seamlessly. Press Edit -> Primer3 Location. You will now see the below dialog.
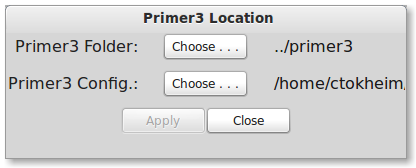
Select a new primer3 configuration file by pressing the Primer3 Config “Choose” button and then select the desired file. Press “Apply” to apply the setting.
4. Select Ouput
Choose a filename to output the results, like “output.txt” in the below example.
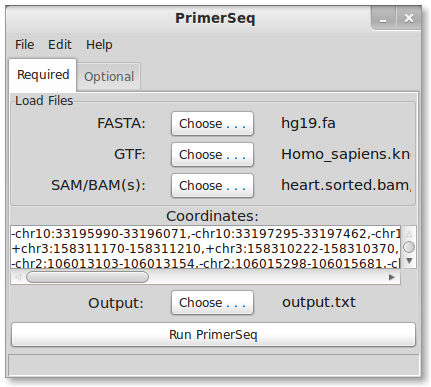
5. Run PrimerSeq
Press the “Run PrimerSeq” button to start primer design.

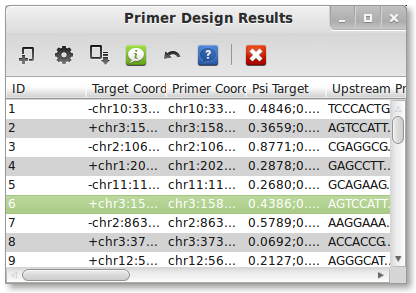
A dialog should appear letting you know that PrimerSeq is designing the primers. Once PrimerSeq is finished the dialog will disappear and a new window with the PrimerSeq results should appear. You can also find your output as a text file as specified in the 4. Select Output step. An example output text file is here. Note that for many cases primer design is successful, however some cases Primer3 may fail to design primers. Try adjusting primer3 options (see 3. Edit Options) especially PRIMER_PRODUCT_SIZE_RANGE which is the allowable primer product sizes.
6. Plot Results
After running PrimerSeq you can plot the results by pressing the “Create Plots” button in the results window. A dialog should appear as shown below.
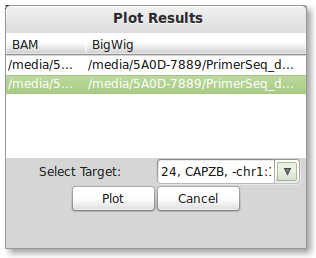
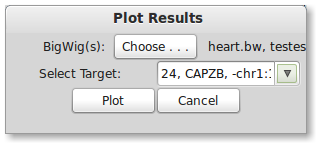
You will need a BigWig file(s) for plotting the results (see more information below). Also you should specify one of the targets you wish to plot in the drop down list.
BigWig
BigWig files store the read depth at positions in the genome. BigWig is a common custom track format used to display RNA-Seq information. Likely if you have a custom track that displays read depth in the UCSC browser (or any other genome browser) than some one has already created a BigWig file for you. For this tutorial we provide you with the BigWig files.
Generating the Plot
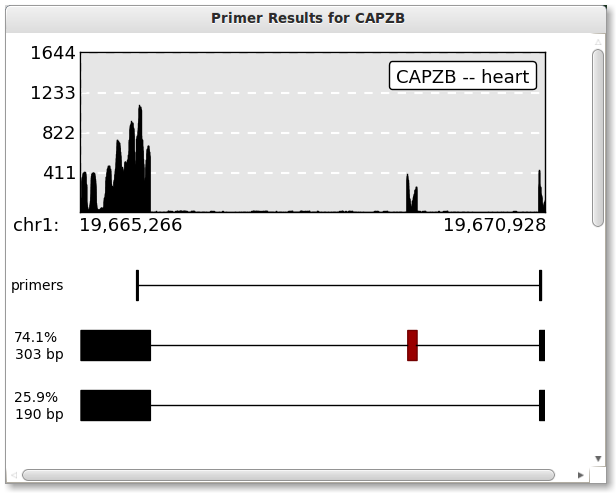
Press the plot button when you are ready. The button should be disabled and say “Ploting …” while PrimerSeq is creating your plot. Once PrimerSeq is finished, a plot window should appear as shown below. Percentage estimates are based based on individual BAM files (mapped read counts).
Evaluating AS Event
Press the “Evaluate AS Event” button to open a dialog. To evaluate AS events, PrimerSeq uses pooled data to find Alternative Splicing events.
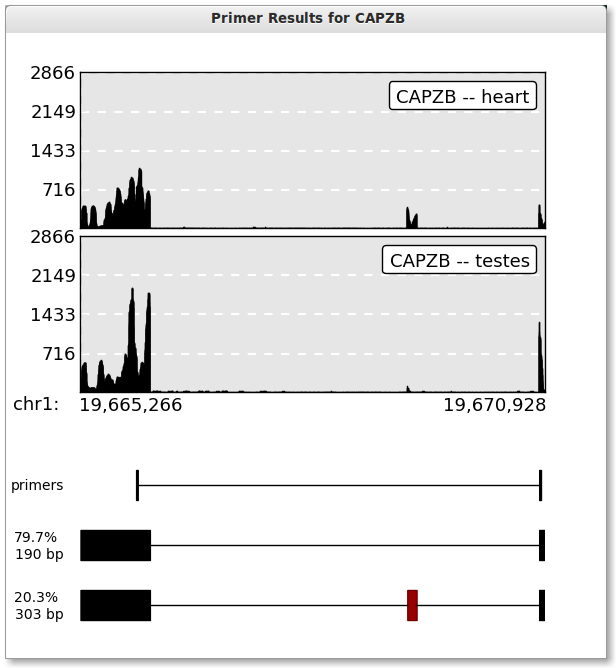
Results based on pooled read counts. Note, you may specify more than one BigWig file by selecting multiple files in the file chooser (hold down control).
Generate an HTML report
Press the “Save Plots” button. The below dialog should appear.
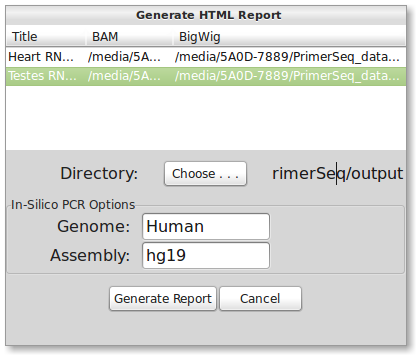
You will need to fill out titles and bigwig files that correspond to the BAM file(s). Click on the table cell to start editing. The first column is the title, second is the BAM file (already filled in), and the third is the corresponding BigWig file (fill in the file path). Specifying a BigWig file is optional and is only needed to display the read depth. An example is shown below:
| Title | BAM | BigWig |
|---|---|---|
| Heart RNA-Seq Data | path/to/heart.sorted.bam | path/to/heart.bw |
| Testes RNA-Seq Data | path/to/testes.sorted.bam | path/to/testes.bw |
If you need a different Genome/Assembly then Human/hg19 then please read the FAQ page. You will also need to specify the directory you wish to save the HTML files to. When ready, press the “Generate Report” button. Generating the HTML may take a couple of minutes. When finished, the web page should automatically open in your browser. An example output can be found here.
In-Silico PCR
As a secondary check for primer design, you can quickly run the In-Silico PCR from UCSC Genome Browser through PrimerSeq. Press the In-Silico PCR button in the tool bar of the results window. The below dialog should now appear.
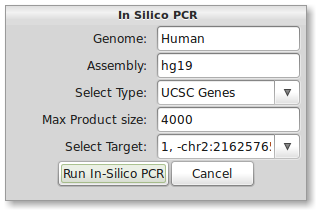
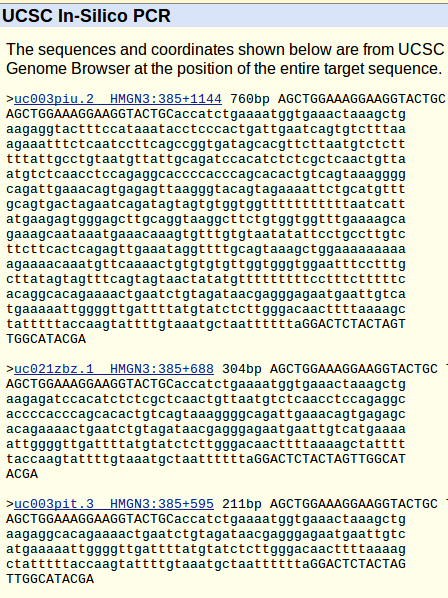
The correct input for human hg19 should be present by default. To use other species or assemblies you will need to look at the naming on the UCSC’s In- Silico PCR webpage. Now select the only available option from the “Select Target” drop-down list. When ready, press the “Run In-Silico PCR” button. Your default web browser should now open the results of In-Silico PCR. In this case there was unavoidable amplification of a second gene since the two genes overlapped. This scenario highlights that In-Silico PCR should be done to identify non-intended amplification.
